


Das kann der CH TRADE FINDER (Bot)

Während sich die Standardversion dieses Tools auf die reine Strukturabbildung und geometrische Visualisierung konzentriert, wandelt der CH Trade Finder [Premium Hybrid Workstation] rohe Marktstrukturen in ein vollständig systematisiertes, regelbasiertes Ausführungssystem um.
Dieses Premium-Modell wurde speziell für professionelle Trader entwickelt, die nach Setups mit hoher Erfolgswahrscheinlichkeit und der Konfluenz institutioneller Orderflow-Daten suchen. Durch die Integration eines fortschrittlichen Ausführungs-Dashboards, Echtzeit-Risikoberechnungen, eines Makro-Trendfilters sowie einer dynamischen Alarm-Automatisierung eliminiert der CH Trade Finder Unsicherheiten und fungiert als eigenständiges Trading-Cockpit.
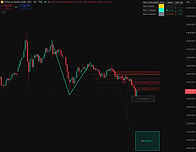
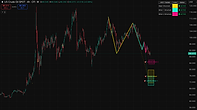


Standard Functions
Dieses Skript ist ein Werkzeug zur technischen Analyse, das darauf ausgelegt ist, die Erkennung, Nachverfolgung und Visualisierung von Marktstrukturen auf der Grundlage aufeinanderfolgender Impuls- und Korrekturbewegungen zu automatisieren. Das Hauptziel des Indikators ist es, das manuelle Einzeichnen von Trendlinien und Fibonacci-Erweiterungen zu systematisieren und dabei die visuelle Übersichtlichkeit im Chart zu maximieren. Das Tool arbeitet auf der Basis eines streng regelbasierten Algorithmus und überwacht Marktstrukturen in Echtzeit über mehrere, vom Benutzer definierte Berechnungsebenen hinweg.
🛠️ Wichtige Funktionsmerkmale:
Mehrstufige Analyse (3 Ebenen gleichzeitig): Der Indikator verarbeitet simultan drei unabhängig voneinander einstellbare Strukturebenen (Major, Minor 1 und Minor 2) auf der Basis anpassbarer Pivot-Längen. Jede Strukturebene wird im Chart optisch voneinander abgegrenzt.
Regelbasierte Aktivierung der Sequenz (Ausbruch bei Punkt B): Um verfrühte oder falsche Signale während Konsolidierungsphasen zu vermeiden, zeichnet das Skript zunächst nur die geometrischen Trendlinien, sobald eine neue A-B-C-Struktursequenz erkannt wird. Das Feld für die Zielerweiterung wird erst dann freigeschaltet und angezeigt, wenn der Kurs das vorherige Strukturhoch bzw. -tief (Punkt B) durchbricht und die Sequenz damit mathematisch aktiviert.
SMC Fair Value Gap (FVG) Konfluenz-Darstellung (NEU): Um einen erweiterten strukturellen Kontext zu bieten, überwacht das Skript kontinuierlich die Phase der starken Kursbewegung (aggressive Expansion) zwischen Punkt C und dem Ausbruchspunkt. Es identifiziert und markiert automatisch unausgeglichene institutionelle Liquiditätsbereiche (FVGs). Diese werden als schattierte Flächen dargestellt, sodass Trader sofort erkennen können, ob ein mathematisches Fibonacci-Verhältnis mit dem organischen Orderfluss des Marktes übereinstimmt.
Automatisierte Ungültigkeitserklärung der Struktur (Unterschreiten/Überschreiten von Punkt C): Wenn der Markt die Struktur durch das Durchbrechen des bestätigten Korrekturniveaus (Punkt C) ungültig macht, bevor die Zielbereiche erreicht werden, gilt die Sequenz als hinfällig. Das Skript entfernt sofort alle zugehörigen Linien, Zielfelder und FVG-Zonen aus dem Live-Chart, um die Übersichtlichkeit zu wahren.
Dynamische Projektion der Zielzone: Sobald eine Sequenz offiziell aktiviert ist, projiziert der Indikator die Zielzone in die Zukunft, wobei die Fibonacci-Erweiterungsniveaus von 1,272 und 1,618 auf der Grundlage der strukturellen Impulswelle berechnet werden.
Vorübergehende Beibehaltung nach Erreichen des Ziels (Grau-Phase): Nach Erreichen der Zielzone wechseln das Erweiterungsfeld und die zugehörigen FVG-Zonen in einen neutralen Grauton. Sie bleiben zu Zwecken des visuellen Backtestings für einen benutzerdefinierten Zeitraum (Standard: 15 Kerzen) sichtbar, bevor sie automatisch ausgeblendet werden, um das Chartbild übersichtlich zu halten.
Dashboard für Echtzeit-Status & Retracement (AKTUALISIERT): Eine direkt im Chart integrierte Tabelle bietet einen sofortigen Überblick über den aktuellen Status aller drei Strukturebenen (⏳ WAITING (C), ● ACTIVE oder ✓ HIT (GRAU)). Zudem verfügt es über eine Live-Überprüfung des Retracement-Tests (Ret. Test), die mathematisch verfolgt, ob ein korraktiver Rücksetzer die Premium/Discount-Schwelle (0,382er Fibonacci-Level) erfolgreich getestet hat, um ein optimales Chance-Risiko-Verhältnis zu gewährleisten.
⚙️ Hinweise zu Nutzung & Konfiguration:
Pivot-Längen, Parameter zur Sichtbarkeit von FVGs (Fair Value Gaps) und visuelle Stile lassen sich in den Skripteinstellungen vollständig anpassen. So ist eine Abstimmung auf jede Anlageklasse (Forex, Krypto, Indizes, Rohstoffe) und verschiedene Handelsstile (von Ultra-Kurzzeit-Scalping bis hin zu Swing-Trading) möglich.
📋 Professioneller mathematischer Haftungsausschluss:
Dieses Skript ist ein automatisiertes Analysetool, das rein mathematische Berechnungen auf der Grundlage historischer Preisdaten, spezifischer Pivot-Punkte und Fibonacci-Verhältnisse durchführt. Es dient ausschließlich Bildungs-, Informations- und Visualisierungszwecken. Das Tool generiert keine automatisierten Ausführungssignale und stellt keine Finanz-, Anlage- oder Handelsberatung dar. Der Handel an den Finanzmärkten ist mit hohen Risiken verbunden; die Nutzer tragen die alleinige Verantwortung für ihre Handelsentscheidungen und ihr Risikomanagement.

CH Trade Finder (Bot) – Täglicher Überblick
Mit unserem vollautomatisierten CH Briefing Bot verpassen Sie und Ihre Community nie wieder ein entscheidendes Setup an den Märkten!
Der Bot analysiert täglich automatisch Top-Assets – sowohl auf Basis des Tagescharts (1D) für Makro-Trends als auch des Stundencharts (1H) für hochpräzise Intraday-Setups.


Was beinhaltet das tägliche Briefing?
📊 Abgedeckte Assets: BTC, Gold, Öl sowie die Tech-Giganten der „Magnificent 7“ (Apple, Nvidia, Microsoft, Amazon, Meta, Alphabet & Tesla).
🟢🔴 ATMI Trend Cloud: Sofortiger Einblick in die aktuelle Marktdynamik (bullisch/bärisch) über beide Zeitrahmen hinweg.
🚨 AFET Pattern Detector: Automatisches Screening auf aktive harmonische ABCD-Setups – inklusive präziser Fibonacci-Einstiege (0,5 Fib), Stop-Loss (Punkt C), Take-Profit (1,272-Ziel) und exakter Chance-Risiko-Verhältnisse (CRV).
💡 CH Top Picks des Tages: Kurze Zusammenfassung der Setups mit der höchsten Erfolgswahrscheinlichkeit und dem besten Chance-Risiko-Verhältnis.
Zeitplan
Zweimal täglich direkt in Ihren Telegram-Kanal geliefert:
🌅 07:00 Uhr (Vor Handelsbeginn in Europa)
🌆 19:00 Uhr (Abend-Update)
Maximale Klarheit. Keine Chart-Überlastung. Erstklassige Umsetzung.

👑 Funktionen des Premium-Upgrades:


Regelbasierte Ausführungsebene (0,500 Fibonacci-Einstieg): Anstatt die Strukturbildung nur zu beobachten, fixiert das Premium-Modell mathematisch die optimale institutionelle Discount-/Premium-Zone auf dem 0,500-Fibonacci-Retracement-Niveau. Dies dient als Ihr strikter, vordefinierter Auslöser für die Orderausführung bei einsetzenden Pullbacks.
Live-Matrix für das Chance-Risiko-Verhältnis (CRV): Das Premium-Dashboard überwacht nicht nur den Status, sondern berechnet in Echtzeit das exakte Chance-Risiko-Verhältnis (CRV) für alle drei Strukturebenen. Es misst den präzisen Abstand zwischen dem 0,500-Einstieg, dem Invalidation-Level bei Punkt C (Stop-Loss) und der 1,272-Extension (Take-Profit), was ein sofortiges Risikomanagement des Portfolios ermöglicht.
Globaler Makro-Trend-Indikator (ATMI-Integration): Handeln Sie niemals gegen das Momentum der höheren Zeitebenen. Die Premium-Version verfügt über einen integrierten Filter für den globalen Markttrend direkt im Dashboard. Durch die kontinuierliche Analyse der ATMI-EMA-Wolke signalisiert das Skript sofort, ob ein strukturelles Setup mit dem allgemeinen Marktmomentum übereinstimmt (🟢 BULLISH) oder eine Gegenbewegung darstellt (🔴 BEARISH).
Integriertes Performance- & Trefferquoten-Tracking: Das Dashboard enthält ein statistisches Live-Modul, das die genaue Gewinn-/Verlust-Historie sowie die mathematische Trefferquote jeder Strukturebene erfasst. Dies ermöglicht es Tradern, den Erwartungswert (Expectancy Score) des aktuellen Assets in Echtzeit zu bewerten und auch bei wechselnden Marktzyklen auf fundierte Daten zu vertrauen.
Dynamische alert()-Funktionen (vollautomatisch): Verwandeln Sie Ihren Chart in einen 24/7-Scanner. Durch die Nutzung der Option „Any alert() function call“ sendet der CH Trade Finder kontextreiche, dynamische Benachrichtigungen direkt an Ihr Gerät:
Benachrichtigungen bei Zielerreichung: Signalisiert den exakten Moment, in dem ein Etappenziel erreicht wird.
Invalidierungs-Benachrichtigungen: Informiert Sie sofort, wenn Punkt C durchbrochen wird, sodass Sie ungültige Pending Orders umgehend löschen können.
Alarm-Einrichtung: Löst sofort aus, sobald eine neue Struktur in die Phase „Waiting (C)“ eintritt, und übermittelt die genaue Richtung, den Einstiegskurs bei 0,500 sowie das Kursziel bei 1,272.
⚙️ Hinweise zu Nutzung und Konfiguration:
Pivot-Längen, EMA-Einstellungen, FVG-Parameter und visuelle Stile lassen sich in den Skript-Einstellungen vollständig anpassen. So ist das Tool für jede Anlageklasse (Forex, Krypto, Indizes, Rohstoffe) und diverse Handelsstile (von extrem kurzfristigem Scalping auf 1-Minuten-/5-Minuten-Charts bis hin zu Swing-Trading) geeignet.
Sichere Dir deine kostenlose 7-Tage-Testversion in 2 einfachen Schritten.
Möchtest Du die volle Leistungsfähigkeit der CH Trading Suite risikofrei erleben? Sichere Dir sofortigen Zugriff auf einen der CH Trading Suite-Indikatoren für die nächsten 7 Tage. Keine versteckten Kosten, jederzeit mit einem Klick kündbar.

Gib deinen TradingView-Benutzernamen ein

Öffne deine Chart und beginne mit dem Trading.
Öffne TradingView, gehe zum Reiter „Indikatoren“ und klicke auf „Skripte nur auf Einladung“. Dort findest du den CH-Indikator. Füge ihn deinem Chart hinzu und genieße 7 Tage lang absolute Klarheit über das Marktgeschehen!
Sichere Dir dauerhafte Klarheit: Unbegrenzter Zugang zur
CH Trading Suite
Erhalte uneingeschränkten Zugriff auf unser gesamtes algorithmisches System, das auf drei Säulen basiert. Keine gesperrten Funktionen, keine verzögerten Daten – sondern pure Markttransparenz auf institutionellem Niveau, die Monat für Monat direkt in Deine Charts geliefert wird.

Über unseren Whop-Shop abonnieren
Wir wickeln alle weltweiten Mitgliedschaften über Whop ab – den weltweit sichersten und am stärksten automatisierten Marktplatz für professionelle Trading-Tools. Der Einstieg dauert weniger als eine Minute:
-
Schritt 1: Klicke auf die untenstehende Schaltfläche „UNLIMITIERTER ZUGRIFF“, um unseren offiziellen Whop-Store zu besuchen.
-
Schritt 2: Wähle monatliches Abonnement aus und gib während des reibungslosen Bezahlvorgangs Deinen TradingView-Benutzernamen ein.
-
Schritt 3: Die Freischaltung findet innerhalb von 24h statt. Öffne einfach TradingView, prüfe den Reiter „Nur auf Einladung“ (Invite-Only Scripts) und beginne sofort mit dem Handel.
*Mit dem Abonnement der Dienste der CH Trading Suite bestätigen Sie, dass Sie die Bedingungen dieses Risikohinweises gelesen und verstanden haben und ihnen zustimmen.